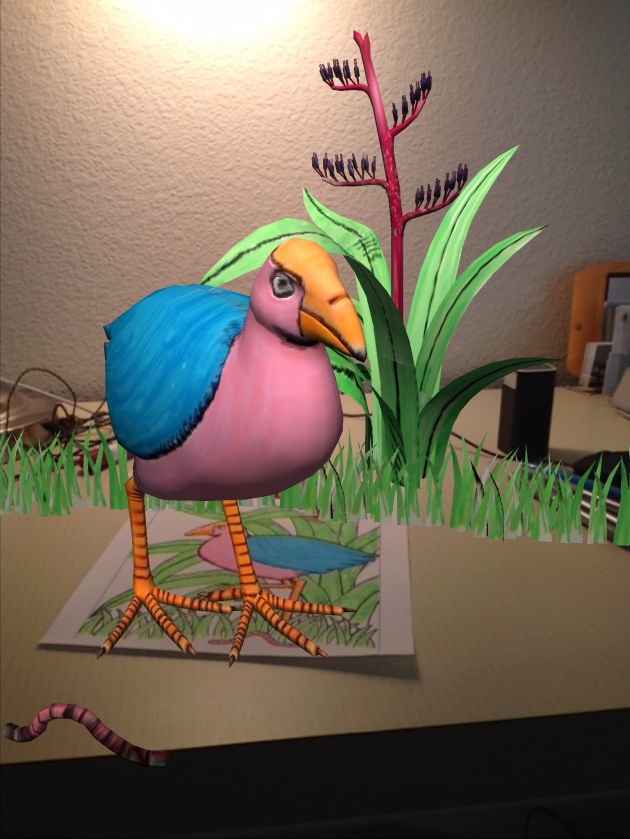
I visited the Tech Museum last weekend and I was really inspired by it. It is not like a regular museum, almost all of the displays are interactive. I love trying out new tech and new ideas, and my visit to the Tech Museum shows that.
On that same note, I have been in contact with the people at Versal. Specifically Carlos Cuadra, the head of Content and Author Relations. I have been looking for something to implement the flipped classroom with. I was thinking about TED-Ed, but it is very restrictive on what you can put in it. Versal allows you to do the same thing, but you just drag and drop whatever element you want. I hope to have a chat with Carlos on Wednesday and see if Versal is up to the task of running a class, even though they just launched the platform July 9th!
Here is my PQ, CQ, Technology, and Me video.
Jul 24, 2013
PQ + CQ > IQ
Posted by
raystuckey
on
Jul 24, 2013
education technology
,
maetel1
,
motion
,
TED-Ed
,
thetechmuseum
,
versal
,
youtube
No comments
Jul 23, 2013
Wicked Problem: Reimagine Online Learning, Final
Posted by
raystuckey
on
Jul 23, 2013
education technology
,
google docs
,
maetel1
,
motion
,
photoshop
,
voicethread
1 comment
How Do We Reimagine Online Learning?
Visit Our VoiceThead!
The demand for online learning is challenging us to rethink what learning via the network can and should deliver — whether the provider represents one of the world’s leading universities, a for-profit provider of skills or business training, or a school system trying to meet the needs of increasingly disengaged learners. Simply delivering content is no longer enough. Students expect learning that matters; learning connected in timely ways to the real world; learning that engages their interests; and learning experiences that see them as entire persons, not just consumers of content. Online learning owes its heritage to distance learning, but in today’s world, online learning is something even residential students want and expect. How to make online learning realize its full potential is a wicked problem because we are not even sure of the questions we need to ask so we can begin to understand what to refine, and what to improve. More experimentation, more data about every dimension of online learning, and new fresh ideas are needed to even begin to define the directions in which development should be taking place. Our task for this assignment was to look at this complex problem and come up ways to move forward with online learning.
This was a collaborative project between Ray Stuckey, Renee Jorae, Tammy Montgomery, Yalonda Combs. Our project began by looking at the 2013 Horizon Report and focused on Online Learning. We spent hours and hours together online in Google Hangouts, texting and talking on the phone together for our presentation. This was often a challenge: Ray is in California, Tammy is in Georgia, Yalonda and Renee are in Michigan. All of us have other responsibilities as well that we needed to work around. Ray and Renee spearheaded the technical end of the project, but quickly gave more responsibilities to Tammy and Yalonda. As you watch the VoiceThread you will see that each of us contributed to research, creating script, and speaking. This was a massive project and truly a wicked problem! We are proud of the work we did together and we hope our work will help teachers implement online learning in their classroom. Attached is our project overview which includes our script and layout.

View Our Thinktank and Transcript
NLP Update Final
Posted by
raystuckey
on
android
,
android development
,
android sdk
,
android studio
,
camtasia
,
education technology
,
maetel1
,
nlp
,
photoshop
No comments
The assignment of the Network Learning Project was to learn how to do something using only the Internet. YouTube and forums were to be the main source of information. Also we couldn't pay anyone to help us either. I choose to make an app for my phone. Here are my comments about the whole process.
Jul 22, 2013
Repurposing Playtime #3
Posted by
raystuckey
on
Jul 22, 2013
education technology
,
littlebits
,
maetel1
,
playtime
,
social robots
,
thetechmuseum
1 comment
Assessment
If I were to based my evaluation of maker culture only on the experiences I had with Littlebits in the maker projects in the MAETEL session, I would walk away and never look back. That's not to mean I don't like Littlebits, I just don't see them fitting into my class. I think having the parts that are easy to snap together and have identified input, functions, and outputs makes it more accessible to everyone.
I went to the Tech Museum in San Jose and they had a display called "Social Robots," and they acted a little bit like "Bigbits," if you will. I'll let Katie explain them.
The part that made this interesting, and Katie even says so, is the best part in dressing up the robot. I had fun dressing up Agnus to help in the hospital, and I think adding that context guided everyone into making friendly robots, even if they are carrying a needle.
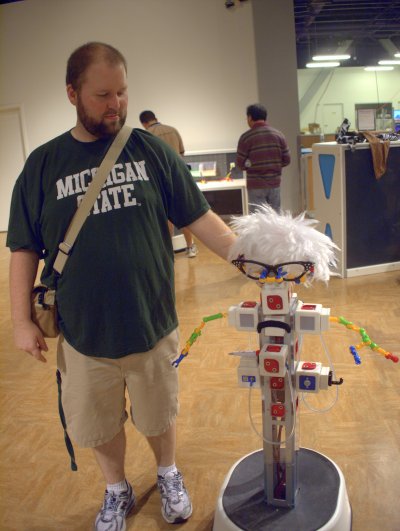
Me and Agnus
So, I had a fun time playing with the robots, but what do they do? If they point was to raise the spirits of someone in the hospital, it might have worked. If the goal was to learn some Algebra, I don't see any application. Now, if I was the person making and putting together the robot parts, I would have learned a lot from it.
From the gallery floor, you can peek into the maker space for the museum and see parts of the robots half assembled. If you could buy a robot kit and put it together as a class, that would be very cool. Lots of things could go wrong, but kids could work separately on each cube if they wanted.
As we move forward, I think the adoption of the Common Core Standards is going to provide an opportunity for change the inertia of our curriculum. Right now, I hardly have to look at the Standards, but because my school district has created a pacing guide that tells me what skills I have to teach, and in what order. I just learned today that I will be teaching Course 1 next year, so I can be a guiding force for what is going to be put into the pacing, or whether we should have a pacing guide at all. I would like to see the format of the pacing guide change to focus on large project instead of little skills. Right now, the pacing guide lists all 89 skills that we have to teach, which gives us about 2 days skill, and then we move on. I have been more successful when I don't do that. Students can't learn that many separate skills that quickly. What they can do is work on large projects that incorporate a few skills that they spend time with. Having a maker project would be something that I would consider doing, but it will not be with the Littlebits.
Jul 19, 2013
NLP, update 2
Posted by
raystuckey
on
Jul 19, 2013
android
,
android development
,
android sdk
,
android studio
,
education technology
,
maetel1
,
MIT app inventor
,
nlp
,
scratch
,
udacity
No comments

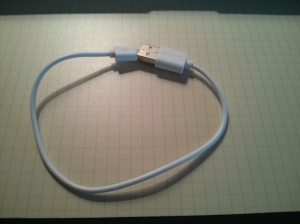
First, this cable isn't a data cable. It just charges. Which I guess is ok, but annoying.
My app does something!
Just a text box, that then displays the text.


Wait, this isn't right. Crap.


Oops. Very important step.
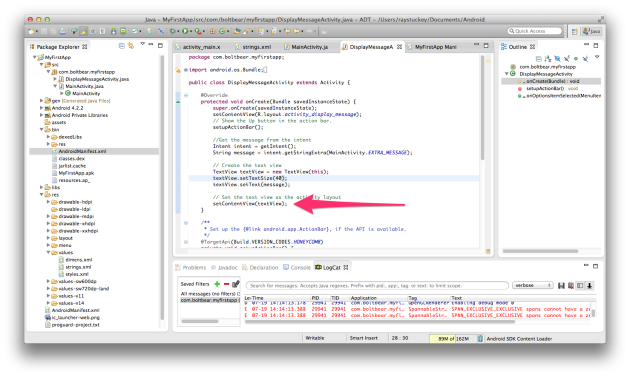
All better now.


This was actually the end of the first tutorial by Google and it was pretty good. It assumed you knew nothing, explain each step like I was a child, and then showed me what the code should look like when its done. It was a good start. The next tutorial however, was nothing I was interested in. Actually the next two.
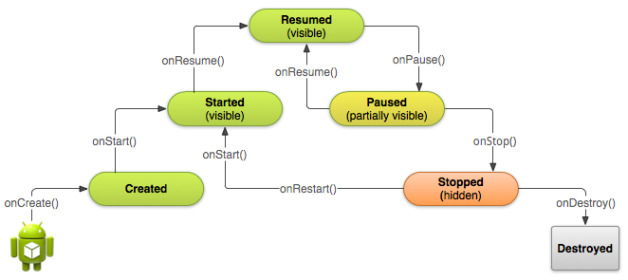
I guess it is important to understand about the lifecycle of the app, but I don't know how to do any of the processes that would even require any of that. I learned how to make a text box and a button. None of this matters for me right now. So that tutorial kind of fizzled out for me and I'm a little stuck right now.
So I starting playing around. I originally started with the Android SDK, which is basically Eclipse with the Android plugins all in one nice package. But El Goog released a new IDE called Android Studio, which to my eye is basically the same thing, but its not built on Java, so the interface is much, much faster.
Scratch
I also took a look at the MIT App Inventor. It was neat, the setup was a little different and maybe easier. Probably easier on Windows but I didn't find the setup on the Mac particularly difficult. It uses the same type of puzzle-piece snap-together programming that Scratch uses, but I haven't learned how to do that yet. Scratch was also developed at MIT, and its the programming language that is features on the Raspberry Pi. It doesn't really interest me at this point.
My next step is tough. I need to find something that's at my level. And that level is being new to Android and being new to Java. I don't know right now which one is tripping me up the most. XDA has a tutorial that I'm going to look at next. There's also one on linux.com that is multiple parts that might be helpful as well.
Its funny how when I was learning how to program in Python last summer I felt really challenged, but really successful using Udacity. I keep looking for something like that. I want an actual curriculum that is thought-out from start to finish to follow, because I don't know the ins-and-outs of Android yet. Udacity released a class on Java Programming which is looking very tempting to do. I bet I could get it done before school starts on August 14.
NLP log, supplemental 3
Two things getting started day. First, this cable isn't a data cable. It just charges. Which I guess is ok, but annoying.
Second, I must remember to run
adb start-server
when I start everything or ADT will give stupid errors.
My app does something!
Just a text box, that then displays the text.
Wait, this isn't right. Crap.
Opps. Very important step.
Jul 18, 2013
Using Technologies to Support Dysgraphia
Posted by
raystuckey
on
Jul 18, 2013
dsygraphia
,
education technology
,
iWriteWords
,
maetel1
,
myscript calculator
,
siri
,
textexpander
,
voicethread
No comments
Dysgraphia
Dysgraphia is a learning disability that affects writing. Dysgraphia affects the development of writing or drawing and can prevent an individual from using writing to clearly communicate (Garate, 2006). Gubbay (1995) found that children with dysgraphia are 9 times more likely to make mistakes while writing single words, and 6 times more likely to make mistakes while forming single letters at age 13 to 14. Deuel (2002) found that there are main reasons for impairment: cognitive, either linguistic or spatial, or motor function. Dysgraphia is usually identified by a student's poor handwriting and inability to complete writing tasks in a timely manner.
Shawn, 2009
I had an experience with a dysgraphic student during my first years of teaching. I was teaching band at a middle school for 7th and 8th grade. Shawn seemed like a normal 7th boy, or as normal as 7th grade boy can get. He was bright, very social, and he practiced his clarinet everyday. Maybe he would trip over his feet sometimes, but that's normal for growing boy. When I can to chair auditions, I assumed he would do fine. He did not. But we needed trombones, so I gave him one, and told him to go figure it out. He came back the next day and he had gotten the hang of it. By the end of the year, he was one of the best trombone players and leader in the band. In the meantime, the counselors and other teachers had diagnosed him with dysgraphia. The reason why the switch to trombone had worked for him is because to play notes, he just had to move his arm. With the clarinet, he had to move all his fingers independently and in tiny motions. The was nothing wrong with his musical ability, or his knowledge of how to read notes, he just didn't have the fine motor control for his fingers. Changing notes on a trombone is done by a large muscle movement, and he was successful.
Tools
There a many tools that can be used in a classroom to help students with dysgraphia. Although many tools can help students with dysgraphia, it is important to still practice handwriting. Handwriting is a life skill that should not be avoided. Sanacore (1991) finds that students with dysgraphia are greatly helped by seeing their writing clearly on a computer.TextExpander takes small snippets of frequently used text and expanded them. For example, type in ;em and it will expand to your email address. This saves time typing often repeated phrases.
There are many voice dictation program available. A few years ago, you had to buy a program like Dragon. Now, voice dictation is built into Windows and Mac. I'm even dictating this right now. Even cell phones are getting the ability to talk to them with Siri and Google Voice Search. Any of these programs would allow someone with dysgraphia to talk through a paper instead of having to write or type it out.
VoiceThread allows the user to record their voice and attach it to a slide. They can make their slides either pictures, or videos, and other people can comment on the same slide. In addition to not having to write or type, getting verbal feedback from anyone is great.
One of the newer recommendations is a calculator, but not just any calculator. MyScript Calculator lets the user draw on the screen with their finger instead of tapping. This is a huge benefit for a person with dysgraphia because on a screen the size of an iPad, it makes writing more of a gross motor movement than a fine motor movement.

An app to reinforce handwriting would be iWriteWords. It is targeted more for toddlers, and I think the childishness might be a bit too much older kids. Just like MyScript Calculator, it focuses on large motor movements to practice drawing out letters.
Living with a learning disability can be difficult. Every learning disability is different and every child is different. With dysgraphia, it may always take extra time to write a paper, or to do math homework. But there are many technologies that can ease the transition to be better students.
Deuel, R. (2002). Dysgraphia. CONTINUUM: Lifelong Learning in Neurology, 8(5, Learning Disabilities). Retrieved from http://journals.lww.com/continuum/Fulltext/2002/08050/Dysgraphia.4.aspx
Garate, T. (2006). Learning disability. In G. Albrecht (Ed.), Encyclopedia of disability. (pp. 1033-1035). Thousand Oaks, CA: SAGE Publications, Inc. doi: 10.4135/9781412950510.n503. Retrieved from http://knowledge.sagepub.com.proxy2.cl.msu.edu/view/disability/n503.xml?rskey=vV55Rh&row=2
Gubbay, S. S., & de Klerk, N. H. (1995). A study and review of developmental dysgraphia in relation to acquired dysgraphia. Brain and Development, 17(1), 1–8. doi:http://dx.doi.org/10.1016/0387-7604(94)00110-J. Retrieved from http://www.sciencedirect.com.proxy2.cl.msu.edu/science/article/pii/038776049400110J#
Miceli, G., Silveri, M. C., & Caramazza, A. (1985). Cognitive analysis of a case of pure dysgraphia. Brain and language, 25(2), 187–212. Retrieved from http://www.ncbi.nlm.nih.gov/pubmed/4063789
Rosenblum, S., Weiss, P. L., & Parush, S. (2004). Handwriting Evaluation for Developmental Dysgraphia: Process Versus Product. Reading and Writing: An Interdisciplinary Journal, 17(5), 433–458. Retrieved from http://ezproxy.msu.edu/login?url=http://search.proquest.com/docview/62077912?accountid=12598
Sanacore, J., & Alio, A. (1991). Computer Applications: A Schoolwide Innovation. The Clearing House 65(2), 77-79. Retrieved from http://www.jstor.org.proxy2.cl.msu.edu/stable/info/30188665?&Search=yes&searchText=dysgraphia&searchUri=%2Fbetasearch%2F%3Facc%3Don%26Query%3Ddysgraphia%26wc%3Don

Technology Integration in Communities of Practice
I send my survey out through the school email to all faculty and staff at my school on July 10th, 2013. By July 18th, I received 20 responses. This sample is a convenience sample, and not considered random. Math teachers are over-represented, and the method of surveying would bias the results towards the tech-savvy since it was conducted over email, and over the summer.
Form
Results
How comfortable do you feel with technology in your personal life?

Mean = 3.5
How comfortable do you feel teaching with technology in your classroom?

Mean = 3.3
Teachers report feeling comfortable with technology in their personal lives and in their classrooms. They are only slightly less comfortable in their classrooms. There were only 7 teachers that changed their response. Five rated their classroom use lower, and, surprisingly, 2 rated their classroom use higher.
How often do you use technology in your classroom?

Technology usage is very frequent at the school. Seventy percent of respondents report using technology everyday, and 85% use it at least once a week. Although for the English & PE teachers that only uses it "once or twice a year," I hope they didn't use half of their computer time responding to my survey.
How familiar are you with Khan Academy?

Mean = 2.25
How often have you used Khan Academy in your classroom?

I don't know why I asked about Khan Academy. If I want to know who is using it, I can just look at our computer lab calendar. We have a dedicated lab for in the math wing and it is booked most of the time, around 70%. It is interesting that most of heard about it, but never used it.
I seems as if the knowledge about Khan Academy is there, and many teacher might not think it is useful in their class. Since it is only one of the many online tools available, maybe we can find some others that are more appropriate for them.
How well do you think our school integrates technology into learning?

Mean = 2.45
How well do you think you integrate technology into learning?

Mean = 2.7
I asked these two questions just so I could geek out with stats for a little bit. Let's take a look at the individual data.
This is dependent data, so the corresponding elements in each list are from the same person. Let's see what the difference is between how they rate themselves and how they rate everyone else.
Ten people rated themselves the same, three worse, and 7 better. We can ignore the people who rated themselves the same, but look at the better and worse. More than twice as many people rated themselves better! If you ask everyone what they think average is, and then use the data to find out what the average actually is, it should be the same. But it turns out that more people think they are better than average. This a fun statistical phenomenon that shows up a lot. Udacity has a fun lesson on it.
What is the best way for you to learn about new technologies?

I am surprised to see the most common response for technology training was the formal Professional Development. I have been to many of them, and taught a few and the turn-out for them is relatively low, and the enthusiasm not much better. I do think it would be great for teachers to be able to come into other classrooms and observe teachers that are using technology well. That will be something I will bring up at our school.
What subject do you primarily teach?
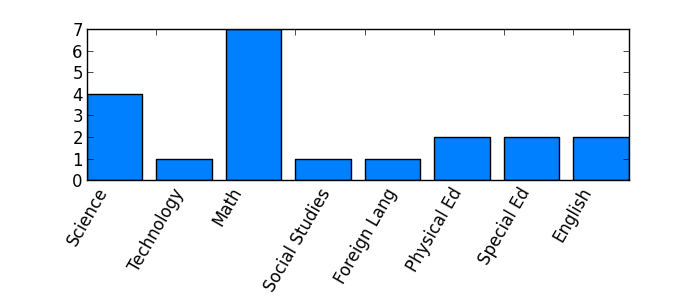
Form
Results
How comfortable do you feel with technology in your personal life?

Mean = 3.5
How comfortable do you feel teaching with technology in your classroom?

Mean = 3.3
Teachers report feeling comfortable with technology in their personal lives and in their classrooms. They are only slightly less comfortable in their classrooms. There were only 7 teachers that changed their response. Five rated their classroom use lower, and, surprisingly, 2 rated their classroom use higher.
How often do you use technology in your classroom?

Technology usage is very frequent at the school. Seventy percent of respondents report using technology everyday, and 85% use it at least once a week. Although for the English & PE teachers that only uses it "once or twice a year," I hope they didn't use half of their computer time responding to my survey.
How familiar are you with Khan Academy?

Mean = 2.25
How often have you used Khan Academy in your classroom?

I don't know why I asked about Khan Academy. If I want to know who is using it, I can just look at our computer lab calendar. We have a dedicated lab for in the math wing and it is booked most of the time, around 70%. It is interesting that most of heard about it, but never used it.
I seems as if the knowledge about Khan Academy is there, and many teacher might not think it is useful in their class. Since it is only one of the many online tools available, maybe we can find some others that are more appropriate for them.
How well do you think our school integrates technology into learning?

Mean = 2.45
How well do you think you integrate technology into learning?

Mean = 2.7
I asked these two questions just so I could geek out with stats for a little bit. Let's take a look at the individual data.
Personal [3, 4, 3, 2, 3, 3, 4, 2, 2, 2, 2, 3, 2, 2, 3, 4, 3, 2, 2, 3]
School   [2, 2, 3, 2, 2, 2, 3, 2, 2, 3, 2, 3, 3, 2, 2, 3, 3, 2, 3, 3]
This is dependent data, so the corresponding elements in each list are from the same person. Let's see what the difference is between how they rate themselves and how they rate everyone else.
Diff [1, 2, 0, 0, 1, 1, 1, 0, 0, -1, 0, 0, -1, 0, 1, 1, 0, 0, -1, 0]
Ten people rated themselves the same, three worse, and 7 better. We can ignore the people who rated themselves the same, but look at the better and worse. More than twice as many people rated themselves better! If you ask everyone what they think average is, and then use the data to find out what the average actually is, it should be the same. But it turns out that more people think they are better than average. This a fun statistical phenomenon that shows up a lot. Udacity has a fun lesson on it.
What is the best way for you to learn about new technologies?

I am surprised to see the most common response for technology training was the formal Professional Development. I have been to many of them, and taught a few and the turn-out for them is relatively low, and the enthusiasm not much better. I do think it would be great for teachers to be able to come into other classrooms and observe teachers that are using technology well. That will be something I will bring up at our school.
What subject do you primarily teach?

Jul 15, 2013
UDL Lesson
Posted by
raystuckey
on
Jul 15, 2013
dyslexie
,
education technology
,
googledocs
,
littlebits
,
maetel1
,
smartboard
,
UDL
,
youtube
No comments
It is quite clear, and I have felt this way from the beginning of the Maker Activities, that the Littlebits don't fit into most curricula. I am surprised at myself that I could come up something that does something, but couldn't fit it into learning something, outside of how to play with Littlebits.
There are many things that I do that I was surprised to find the the UDL Guidelines (2011). Checkpoint 8.1 says to restate the initial goal. I do that all the time. When teaching how to solve inequalities, students always forget that sometimes you have to flip the sign. I put this slide in my lesson about 4 times the first day, and came back to it multiple times in following lessons.
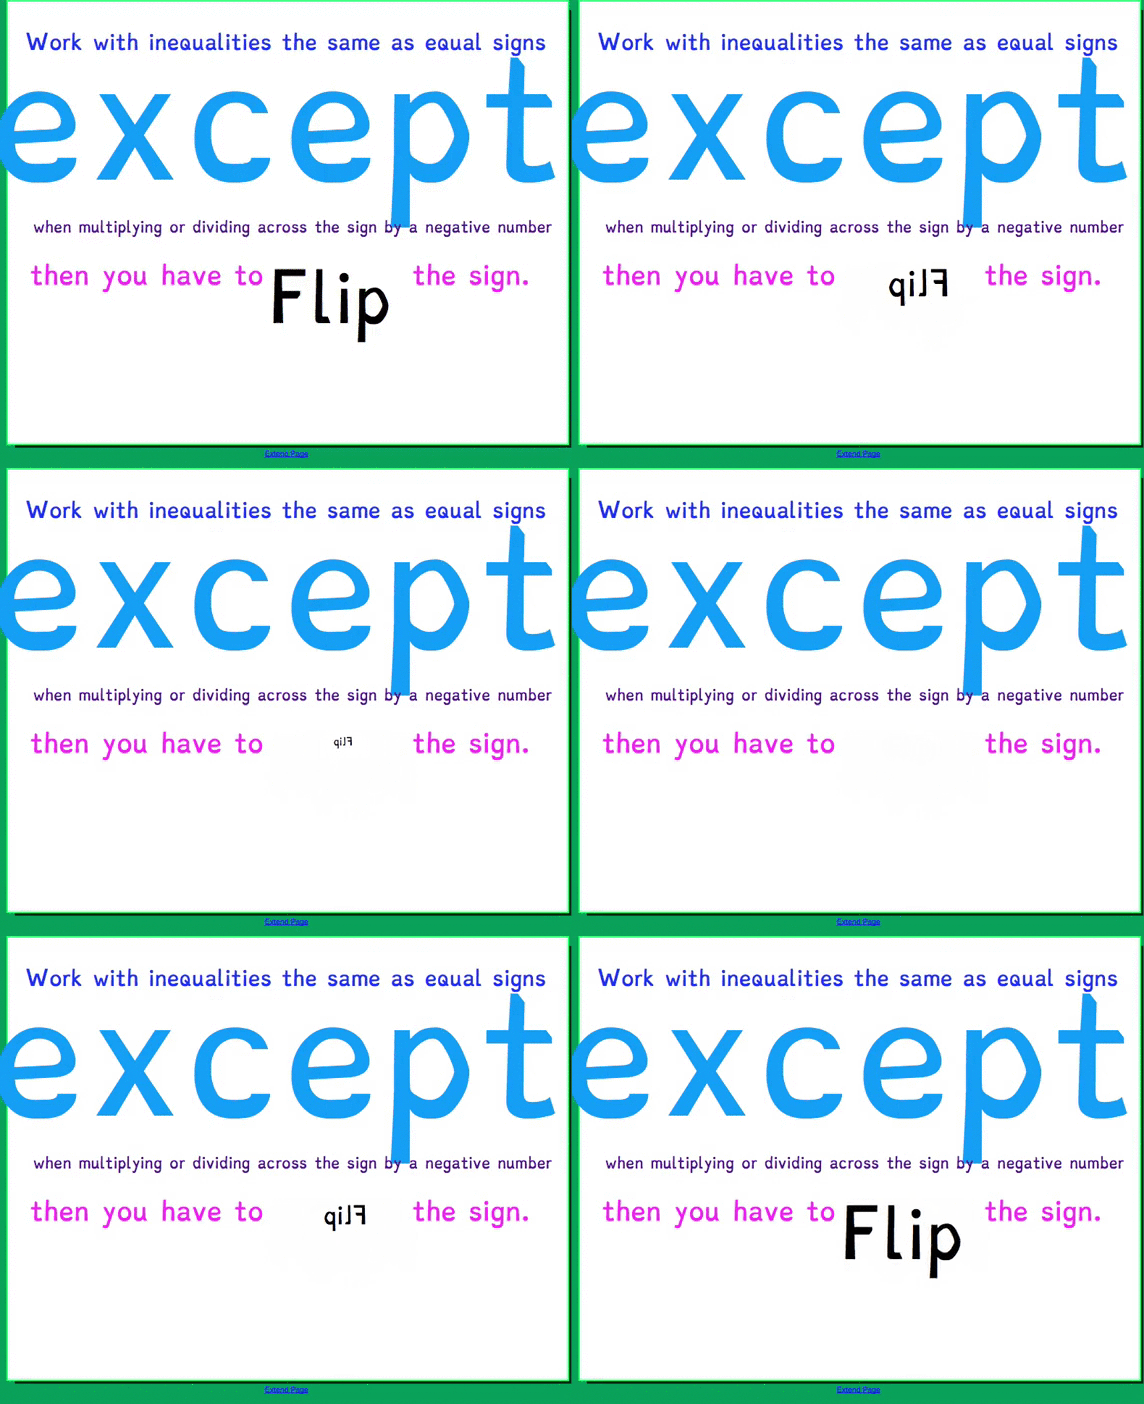
It did help them get the point.
This past year in my class, I had two hard-of-hearing students. The way I have created slide has changed over time to help those students, and it something that could be taken right out of UDL. I have also been getting big classes in my geometry classes. Usually they are above 40, which means that some desks are right up against the back wall. I was noticing that I couldn't really see the SmartBoard from the back of the class so the students probably are having a hard time, too.
1st year teaching geometry

2nd year teaching geometry
3rd year teaching geometry

The first year, it is hard to read, the picture isn't labeled, and the text is tiny. The second year, I was deriving the formula for them, but I never gave them the final presentation of it as a complete theorem. My third year, I seem to have my act together. The text of the formula is big. I color-coded the points to help them follow how the x's and y's travel. And I wrote out the formula in text, which is a huge help for them. I did the same thing this year for my Algebra class with the quadratic formula, and some of the student that couldn't write it in symbols could still recite it for me. This shows me that Checkpoint 2.1 is important because I am showing the formula in different representations. To add to it, I think I would put I diagram of the triangle that was color-coded to the formula.
I have also been using a typeface designed to be easier to read for people with dyslexia, called dyslexie, from studiostudio. I believe it helps everyone read better. I even have it installed on my Kindle and I can read much faster with it.
Example of the dyslexie font

The lesson I am revisiting is the introductory lesson on hypothesis testing for my Statistics class. This lesson took place over 3 days (1 collab period [44 minutes], and 2 block periods [105 minutes]).
This is my UDL Guideline Worksheet for this lesson.
As I was working through the UDL Guideline and putting my notes it, I thought it would be best for me to rate myself with a number and how well I thought I was already doing each element. I made a new column and rated between 1 (didn't do it) to 4 (fabulous). More data is good. Here is my data:
That makes my UDL GPA 2.1. Not very good. The best two ratings were on "Checkpoint 2.2 - Clarify syntax and structure" and "Checkpoint 6.3 - Facilitate managing information and resources." There are two whole groups that I rated myself as a one: "Guideline 9: Provide options for self-regulation" and "Guideline 4: Provide options for physical action."
There are two things I would like to improve. The first relates to flipping the classroom. I would make a video going over the main vocabulary from the text instead of having them just read it. I could also use the video to connect to the previous chapter's concept of confidence intervals and how that relates to α. I would also add closed captioning to this video. We have the school districts Deaf and Hard-of-Hearing program at my school, and they will do closed captioning for youtube videos if you ask them nicely enough. The Means, Toyama, Murphy, Bakia, and Jones (2010) study found that online learning and blended learning produces stronger learning experiences, with blended classrooms having the strongest learning experiences. Flipping the classroom is the first step, for me, to start the online part of my class.
The second thing I wanted to revisit was the worksheet. 8.1b Hypothesis testing unfair coins UDL is my revised worksheet. This is the original 8.1b Worksheet for comparison. I restated the 5 steps for hypothesis testing to emphasize the goal for this lesson again. I rearranged the process to follow exactly how hypothesis testing is done in the rest of the chapter. The "Step #" is clearly laid at the beginning of each step. I put boxes around the parts of the worksheet that are what they will be expected to write when they do tests by themselves. I also put cues in a handwriting font to give them hints about what is expected for that box. On a digital version, I might put a hyperlink or tooltip. In step 5, I used a sentence stem to help prompt them about the structure of what they are supposed to write.
I think the UDL guidelines are very helpful in making great lessons. They offer great starting points about places to think about my teaching and my lesson design. Just as we learn with the Third Teacher+, designing the physical environment our students learned in, the design of the learning experience is important, too. If we do not make lesson accessable to everyone, then they cannot even begin the experience.
CAST (2011). Universal Design for Learning Guidelines version 2.0. Wakefield, MA: Author. Retreived from http://www.udlcenter.org/sites/udlcenter.org/files/UDL_Guidelines_Version_2.0_(Final)_3.doc
Means, B., Toyama, Y., Murphy, R., Bakia, M., & Jones, K. (2010). Evaluation of Evidence-Based Practices in Online Learning: A Meta-Analysis and Review of Online Learning Studies. US Department of Education, Office of Planning, Evaluation, and Policy Development, Washington, D.C. Retrieved from http://www2.ed.gov/rschstat/eval/tech/evidence-based-practices/finalreport.pdf
There are many things that I do that I was surprised to find the the UDL Guidelines (2011). Checkpoint 8.1 says to restate the initial goal. I do that all the time. When teaching how to solve inequalities, students always forget that sometimes you have to flip the sign. I put this slide in my lesson about 4 times the first day, and came back to it multiple times in following lessons.

It did help them get the point.
This past year in my class, I had two hard-of-hearing students. The way I have created slide has changed over time to help those students, and it something that could be taken right out of UDL. I have also been getting big classes in my geometry classes. Usually they are above 40, which means that some desks are right up against the back wall. I was noticing that I couldn't really see the SmartBoard from the back of the class so the students probably are having a hard time, too.
1st year teaching geometry

2nd year teaching geometry

3rd year teaching geometry

The first year, it is hard to read, the picture isn't labeled, and the text is tiny. The second year, I was deriving the formula for them, but I never gave them the final presentation of it as a complete theorem. My third year, I seem to have my act together. The text of the formula is big. I color-coded the points to help them follow how the x's and y's travel. And I wrote out the formula in text, which is a huge help for them. I did the same thing this year for my Algebra class with the quadratic formula, and some of the student that couldn't write it in symbols could still recite it for me. This shows me that Checkpoint 2.1 is important because I am showing the formula in different representations. To add to it, I think I would put I diagram of the triangle that was color-coded to the formula.
I have also been using a typeface designed to be easier to read for people with dyslexia, called dyslexie, from studiostudio. I believe it helps everyone read better. I even have it installed on my Kindle and I can read much faster with it.
Example of the dyslexie font

The lesson I am revisiting is the introductory lesson on hypothesis testing for my Statistics class. This lesson took place over 3 days (1 collab period [44 minutes], and 2 block periods [105 minutes]).
This is my UDL Guideline Worksheet for this lesson.
As I was working through the UDL Guideline and putting my notes it, I thought it would be best for me to rate myself with a number and how well I thought I was already doing each element. I made a new column and rated between 1 (didn't do it) to 4 (fabulous). More data is good. Here is my data:
Rating | Frequency
–––––––+–––––––––––
4      |    2
3      |    10
2      |    8
1      |    11
That makes my UDL GPA 2.1. Not very good. The best two ratings were on "Checkpoint 2.2 - Clarify syntax and structure" and "Checkpoint 6.3 - Facilitate managing information and resources." There are two whole groups that I rated myself as a one: "Guideline 9: Provide options for self-regulation" and "Guideline 4: Provide options for physical action."
There are two things I would like to improve. The first relates to flipping the classroom. I would make a video going over the main vocabulary from the text instead of having them just read it. I could also use the video to connect to the previous chapter's concept of confidence intervals and how that relates to α. I would also add closed captioning to this video. We have the school districts Deaf and Hard-of-Hearing program at my school, and they will do closed captioning for youtube videos if you ask them nicely enough. The Means, Toyama, Murphy, Bakia, and Jones (2010) study found that online learning and blended learning produces stronger learning experiences, with blended classrooms having the strongest learning experiences. Flipping the classroom is the first step, for me, to start the online part of my class.
The second thing I wanted to revisit was the worksheet. 8.1b Hypothesis testing unfair coins UDL is my revised worksheet. This is the original 8.1b Worksheet for comparison. I restated the 5 steps for hypothesis testing to emphasize the goal for this lesson again. I rearranged the process to follow exactly how hypothesis testing is done in the rest of the chapter. The "Step #" is clearly laid at the beginning of each step. I put boxes around the parts of the worksheet that are what they will be expected to write when they do tests by themselves. I also put cues in a handwriting font to give them hints about what is expected for that box. On a digital version, I might put a hyperlink or tooltip. In step 5, I used a sentence stem to help prompt them about the structure of what they are supposed to write.
I think the UDL guidelines are very helpful in making great lessons. They offer great starting points about places to think about my teaching and my lesson design. Just as we learn with the Third Teacher+, designing the physical environment our students learned in, the design of the learning experience is important, too. If we do not make lesson accessable to everyone, then they cannot even begin the experience.
CAST (2011). Universal Design for Learning Guidelines version 2.0. Wakefield, MA: Author. Retreived from http://www.udlcenter.org/sites/udlcenter.org/files/UDL_Guidelines_Version_2.0_(Final)_3.doc
Means, B., Toyama, Y., Murphy, R., Bakia, M., & Jones, K. (2010). Evaluation of Evidence-Based Practices in Online Learning: A Meta-Analysis and Review of Online Learning Studies. US Department of Education, Office of Planning, Evaluation, and Policy Development, Washington, D.C. Retrieved from http://www2.ed.gov/rschstat/eval/tech/evidence-based-practices/finalreport.pdf
8.1 Hypothesis Testing
Posted by
raystuckey
on
coins
,
education technology
,
maetel1
,
notebook
,
python
,
UDL
53 comments
The lesson I am revisiting is the introductory lesson on hypothesis testing for my Statistics class. This lesson took place over 3 days (1 collab period [44 minutes], and 2 block periods [105 minutes]). The goal of the lesson was to use a hypothesis test to determine if the correct probability of getting heads was given. I thought the best way to do this was for them to flip some unfair coins. The easiest way to make unfair coins is to bend them.


Digital Materials:
8.1 Hypothesis Testing Notebook Original PDF
Text Book: Chapter 8.1
8.1b Hypothesis testing unfair coins UDL
8.1 Coin Graphs
Chapter 8 Outline
Outline
Day 1:
Lecture on how hypothesis testing is used to make decisions on data.
Read Textbook 8.1 and do applying concepts and exercises.
Outcome: Students will be familiar with steps of hypothesis testing and vocab. Chapter Outline will be completed for section 8.1
Day 2:
Students will state Ho, H1, confidence interval, and α, flip coins, calculate probabilities, find the critical regions, and summarize their results. Everything will be recorded on the worksheet. This will be done for all 9 coins. Students are expected to collect data individually, but can work together on the process.
Day 3:
Student are randomly assigned a coin number and have to make a mini-poster showing their test. Poster must include all steps of the hypothesis test and a graph of the theoretical probability of the coin with critical regions highlighted.
At the end of the period we will discuss as a class why some people failed the coins even though most people did not and how that relates to α and confidence levels. Also need to find patterns in the graphs of each of the coins, and what effects the probability of each coin had.

Jul 14, 2013
Wicked Problem: Reimagining Online Learning
Posted by
raystuckey
on
Jul 14, 2013
education technology
,
maetel1
,
motion
,
photoshop
,
popplet
,
voicethread
,
youtube
No comments
https://voicethread.com/share/4736677/
How do we re-image online learning?
Visit our VoiceThread @ https://voicethread.com/share/4736677/
Here is a sneak peek!
Many hours were spent in Google Hangouts with Ray Stuckey, Yalonda Combs, and Tammy Montgomery collaborating on this project. Our project began by looking at the 2013 Horizon Report and focusing on Online Learning.
(Intro video) Ray
(iTunes U slide) Tammy
(Udacity Slide) Ray
(Coursera Slide) Londa add Connections academy Human Interaction
(TED-Ed Slide) Renee

How do we re-image online learning?
Visit our VoiceThread @ https://voicethread.com/share/4736677/
Here is a sneak peek!
Many hours were spent in Google Hangouts with Ray Stuckey, Yalonda Combs, and Tammy Montgomery collaborating on this project. Our project began by looking at the 2013 Horizon Report and focusing on Online Learning.
Reimagine online learning. The demand for online learning is challenging us to rethink what learning via the network can and should deliver — whether the provider represents one of the world’s leading universities, a for-profit provider of skills or business training, or a school system trying to meet the needs of increasingly disengaged learners. Simply delivering content is no longer enough. Students expect learning that matters; learning connected in timely ways to the real world; learning that engages their interests; and learning experiences that see them as entire persons, not just consumers of content. Online learning owes its heritage to distance learning, but in today’s world, online learning is something even residential students want and expect. How to make online learning realize its full potential is a wicked problem because we are not even sure of the questions we need to ask so we can begin to understand what to refine, and what to improve. More experimentation, more data about every dimension of online learning, and new fresh ideas are needed to even begin to define the directions in which development should be taking place.
(Intro video) Ray
Digitizing online learning is a wicked problem. How do we bring a traditional classroom onto the Internet? Or is it best to not use a classroom as a metaphor for what online learning should be? The traditional classroom isn't viewed as the pillar of education it once was. It might be best not to start with a failing instructional mode as a model for how to move forward.
(iTunes U slide) Tammy
The first move online has just been to record lectures and retransmit them, iTunes U. While this may have some advantages for students, they can see lectures at other times, or from other places, it fails to bring any benefit from technology. This, we believe, can be the big advantage of online learning. A learning activity like a lecture should be turned from a passive, lean-back, activity to an active, lean-forward, activity.
(Khan Academy Slide) Londa
A lot of work has been done in this area. Many companies have taken a bite into online learning. Khan Academy is one of them. It hosts over 4,200 short videos that cover topics from basic addition to calculus, and a growing collection of science and arts videos. Separately from the videos, is a collection of math exercises that allow users to practice each math skill until mastery. Built into the site is data collection that let’s users and their “coaches” view their progress. The missing piece to this is the progression from one skill to the next. It is not clear which skills are normally covered and in what order.
(Udacity Slide) Ray
Udacity takes a different approach. Founded by a professor from Stanford, short quizzes are integrated into video lectures. Just as a teacher may ask a question in a class, the teachers asks a question in the video and the learner has to answer before the video will continue. At the end of the videos there are larger assignments that must be completed and are checked by computer. This allows the learner to take the course at anytime, and at the pace of the learner, instead of a pace set by the teacher.
(Coursera Slide) Londa add Connections academy Human Interaction
Coursera And Connections Academy are two virtual schools that use video lectures and quizzes as well, but they have a different focus. Each course has a set start and end date, with assignments due each week. Learners are able to work together in groups or as a class through different modes of technology, instead of working individually. Because everyone is working at the same pace this happens more easily. Students also have similar access to their instructors. They focus on human assessment rather than computer grading for many of their assignments.
(TED-Ed Slide) Renee
TED-Ed taylors their courses to meet the needs of the flipped classroom format. The lessons begin with a curated educational video created by educators. The TED-Ed management system allows instructors to use pre existing follow up questions or create their own questions. All learner answers are stored on the TED-Ed system so learners and educators can access these anytime. The platform can be used with any personal video or YouTube video as well.
(Forward Slide)
Tammy
High quality videos by high quality lectures are crucial.
Renee
Computer graded quizzes increases engagement and understanding, and provide immediate feedback.
Ray
The videos should be broken up into small chunks to increase interactivity. And there has to be in-depth assignments.
Londa
Learners can collaborate with each other and the course instructors both online and in-person using multiple modes the internet provides. Humans feedback is given on assignments not just computer generated results.
Renee
Teachers should be able to remix previous lessons.
(Outro Slide) animate bullet points and music

Jul 13, 2013
Online Reading Presentation: Session 4
Posted by
raystuckey
on
Jul 13, 2013
education technology
,
gapminder
,
maetel1
,
TED-Ed
,
twitter
,
wikipedia
,
youtube
3 comments
The Anti- Education Era:
Creating Smarter Students through Digital Learning
By: James Paul Gee
A closer look at Chapters 17 - 19
Big Questions:
- How can, WE, globally use the tools we have to work together to solve wicked problems without judgement of ideas or others?
- How does inequality affect education?
- What creates inequality? How do we solve inequality?
These three chapters of Gee focus on the inequality in society that leads to inequality in the classroom. Your lesson this week takes a deeper look at this issue and asks us to look towards solutions.
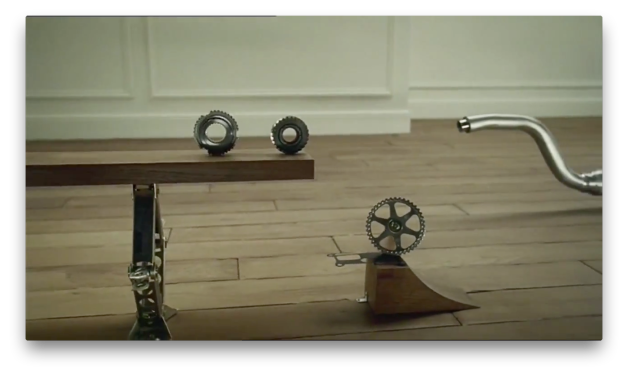
Why are humans so stupid when they should be smarter? Another way of putting this question is: how can, WE, globally use the tools we have to work together to solve wicked problems without judgement of ideas or others? Watch the commercial below. As you watch the commercial, The Cog, keep in mind how the parts are working together to power something larger.
Plenty of thought, time, and effort went into the making of this commercial. Think about all of the parts it took to create the commercial. How did all of the parts contribute to making the whole cog work? If one part is missing the whole cog does not work, but with thought and the right tools it could be restructured to still have a working cog as the end result. According to Gee, WE are one world and we are made up of many different countries, cultures, values, beliefs, passions, prejudices, and religions (think about the many different components of the cog). Currently, all of these things work independently rather than together. Gee posed this idea, “what if human beings are not meant to be individuals, but rather, are meant to be parts of a bigger whole?” (152) How, then, do we get everyone to work together? How we do begin to bridge the inequality gap? Let’s look at this idea of inequality a bit further...
Go through the TEDed lesson below to explore the issues of inequality in today’s society further:
PLEASE FOLLOW THIS PART OF THE PRESENTATION AT http://ed.ted.com/on/JfCkz59b
In chapter 17, Gee (2013) argues that status is determined more by health than by wealth. High inequality has an effect on the health of people in society. A person in a low inequality country will have better health than an equally wealthy person in a high inequality county, no matter the wealth level. Watch the video, pay particular attention to between 9:00 and 15:00.
www.youtube.com/embed/hVimVzgtD6w?rel=0t=9m00s
Rosling says, "Health cannot be bought at a supermarket." (13:25). The CDC released a report in 2011 titles Health Disparities and Inequalities Report detailing the effects of inequality on health. Figure 4 is a great representation of this. A common measure of income inequality is the Gini coefficient, which is used in the CDC report. Utah has the least inequality of all the states, and the best average healthy days. West Virginia has the most inequality and the least number of average healthy days. There is a strong correlation between average healthy days and inequality. Now, take some time to play with the same data that Rosling was using. He used Child Survival vs. GDP per capita. How does that data compare to Life Expectancy vs. GDP per capita? How does health change when compared to inequality? Also look at GDP vs. Inequality.
Gee (2013) argues that societies with low inequalities are better off, top to bottom, than societies with high inequalities, regardless of wealth. To quote him, "Our problems in education are not rooted primarily in our schools, no matter how bad or how good some of them are, but in our society." So it seems the teacher's job is to not only teach reading, writing, and arithmetic, but also to educate a society to work together for more equality.
Please share your thoughts on Twitter with the hashtag #geechat
Gee, J. P. (2013). The anti-education era: Creating smarter students through digital learning (pp. 151-158). New York: Palgrave Macmillan.
Centers for Disease Control and Prevention. CDC Health Disparities and Inequalities Report – United States, 2011. MMWR 2011;60(Suppl).
Rosling, H. (2006, February). Hans Rosling: Stats that reshape your world-view [Video file]. Retrieved from http://www.youtube.com/watch?v=hVimVzgtD6w
CONTINUE HERE.
 Many educational reforms have been implemented in schools to improve the performance of poor and minority students however, the educational gaps between rich and poor remain. It is the high inequality in a society that creates deep divides in educational success. We need to address this inequality and make people feel like they count, like they are a contributing member of society. They need to matter.
Inequality affects education because it is one place where kids from all income levels are included. Schools offer a place to bring communities together and to work to bridge gaps in our society. Schools can be a place to teach collaboration and teach the importance of being a pro-active global citizen: thinking in the WE not the I. What can WE do to help - it is the students of today that are going to be creating the solutions for tomorrow, as teachers, let’s help guide them in that journey. Humans are not smart alone. “Minds linked to other Minds to form a large interacting network of Minds can wage vast war or save vast numbers of lives in public health interventions. What Minds do is determined by some vision of what is good, right, or necessary.” Gee (p 167)
Together we are smarter.

There can be no equality or opportunity if men and women and children be not shielded in their lives from the consequences of great industrial and social processes which they cannot alter, control, or singly cope with.
--Woodrow Wilson
As you think about these questions share your thoughts on twitter using #maetel1 and #geechat.Here are the values that I stand for: honesty, equality, kindness, compassion, treating people the way you want to be treated and helping those in need. To me, those are traditional values.
--Ellen DeGeneres
Subscribe to:
Posts
(
Atom
)
